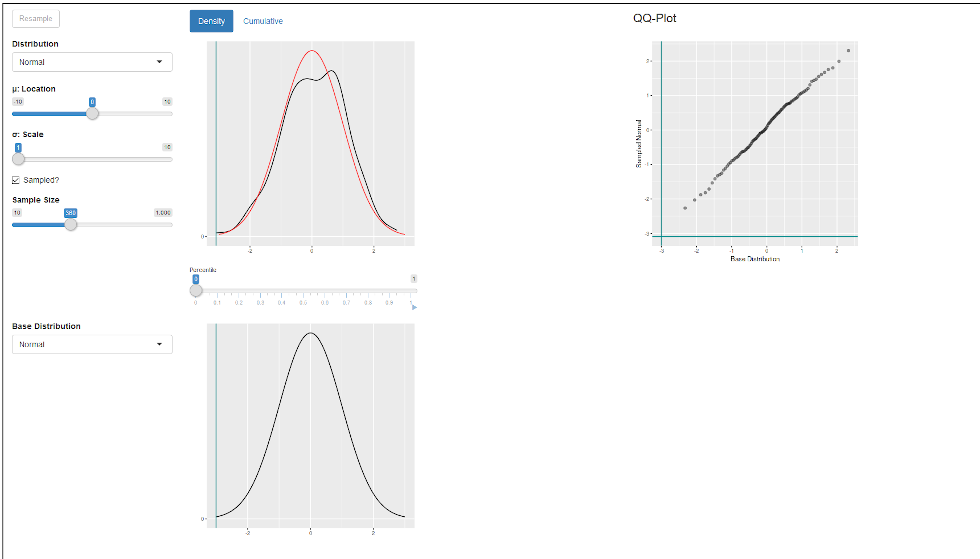
This Shiny app is meant to let you play around with a few different distributions (Normal, Skew Normal, Cauchy, Skew Cauchy), and check what the effect of different variables (scale, location and shape) on their qq-plot is.
The qq-plots are all a comparison with a default normal distribution (mean=0, sd=1). There is a large slider you can use to track specific percentiles on all graphs. This Shiny app was made for teaching purposes.